S&P 500 Breaking Out Again: What This Means for Your Portfolio
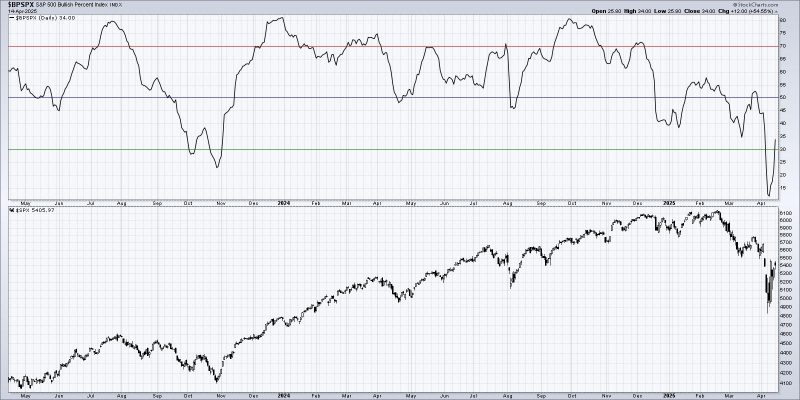
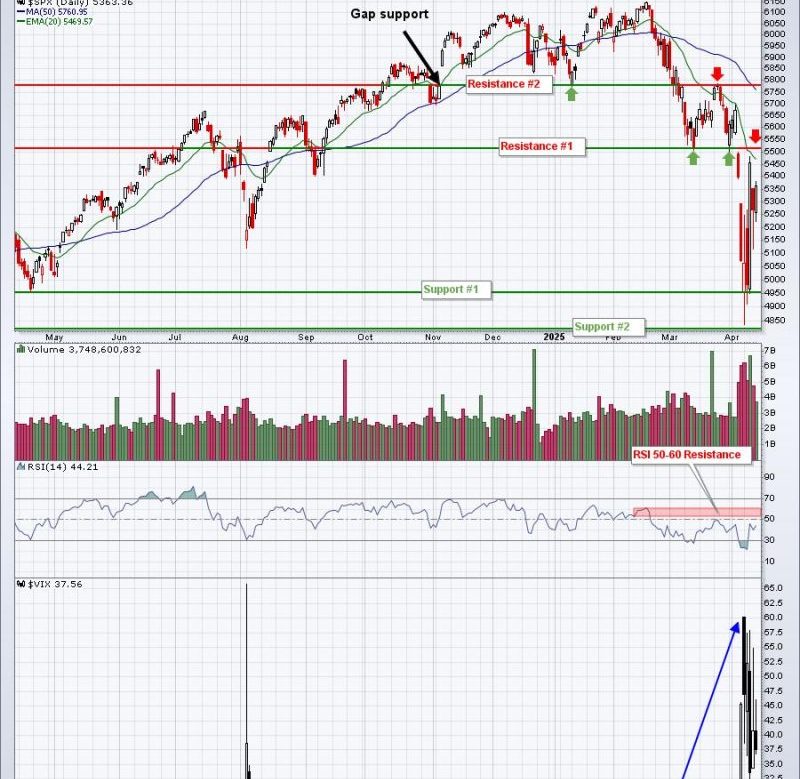
The S&P 500 ($SPX) just logged its fifth straight trading box breakout, which means that, of the five trading ranges the index has
Is the market’s next surge already underway? Find out with Tom Bowley’s breakdown of where the money is flowing now and how you
The chart of Meta Platforms, Inc. (META) has completed a roundtrip from the February high around $740 to the April low at
Markets don’t usually hit record highs, risk falling into bearish territory, and spring back to new highs within six months. But that’s
Here are some charts that reflect our areas of focus this week at XLU Leads with New High Even though the Utilities SPDR
Healthcare Re-Enters the Top 5 After a wild week in the markets, the sector ranking got quite a shake-up. Although only one sector
Panic selling and oversold extremes gave way to a rip higher last week. Stocks are poised to open strong on Monday as
One of my favorite market breadth indicators remained in an extreme bearish reading through the end of last week, standing in stark
The market has been overvalued for some time but how overvalued is it? Today Carl brings his earnings chart to demonstrate how
I pay attention to technical support levels as the combination of price support/resistance is always my primary stock market indicator. We’re